Tips & Tricks
This document gives away a few tips to make visualisations look nicer as well as render faster.
Some issues arise when visualising large graphs: 1) hairballs, large graphs tend to have a large number of edges making for undecipherable graphs, 2) clustering is often needed as it helps make sense of the graph but quickly becomes a bottleneck due to the large number of computations required, 3) computing the layout of the graph can also become and issue with large graphs.
Cluster
Clustering, if not a bottleneck, certainly tends to add computation time to creating the visualisation. What about skipping this step entirely? If you need to know the actual clusters for any statistical analysis, by all means compute it but if your aim is to merely bring to view nodes that are close to one another (e.g.: a community) there is, in grapher, a much more efficient way of doing so.
Since we've already established that you are rendering a large graph one thing you will have to do is to compute the layout the graph offline. Moreover, nodes within the same community should be positioned closed to one another. So why not simply use the layout, the x, y, z coordinates of each node, to define the color?
This is the reason behind scale_node_color_coords, scale_link_color_coords.
g <- make_data(2000)

graph(g) %>%
  graph_offline_layout() %>%
  scale_link_color_coords()
In the graph above communities (not in the strict sense) are put to view, without having computed the clustering.
Hiding links
Plainly hiding links seems blunt but works surprisingly well, bear with me. Again grapher is only worried about making a beautiful visualisation so if a graph tends towards a "hairball" it makes sense to hide links. The benefits of hiding links are numerous.
The alternative is often to remove links (e.g.: with minimum spanning tree) but that results in graph layouts that do not resemble the original graph structure at all, it's in essence a totally different graph. Hiding links allows to keep the global graph structure.
One question remains, which links do we hide?
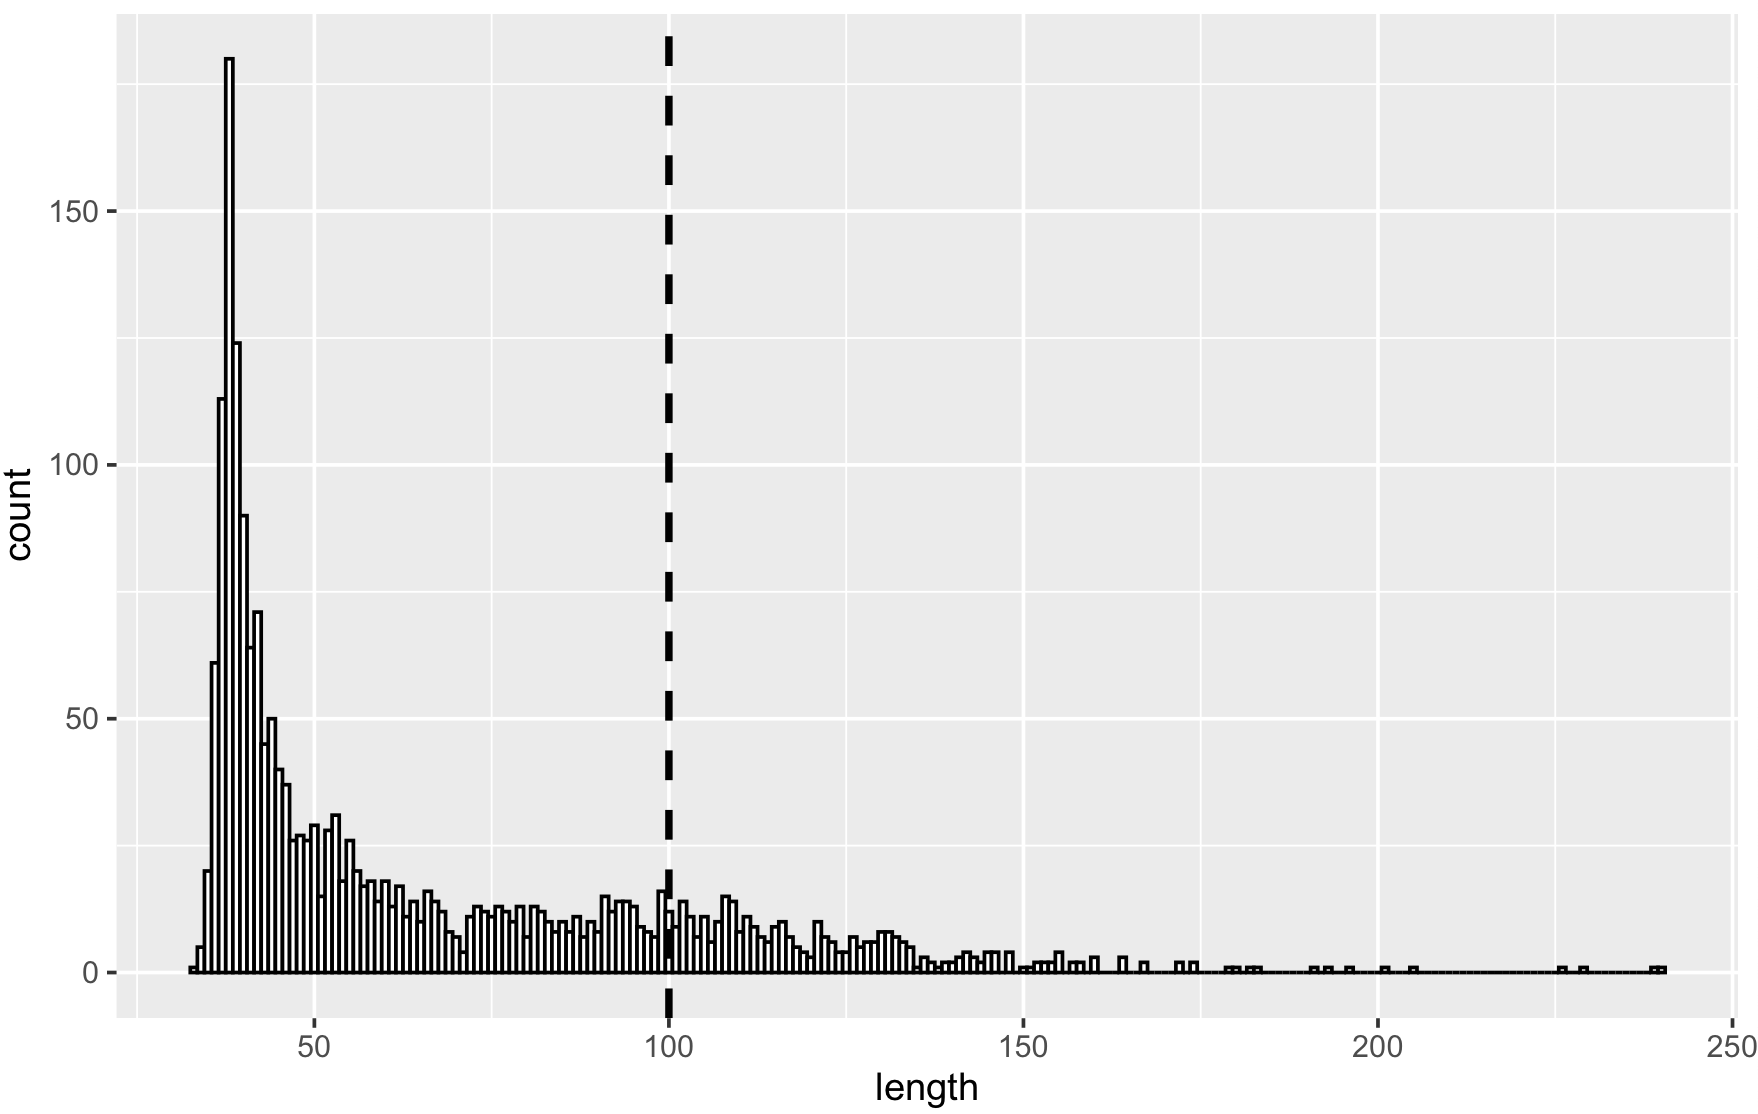
Hiding links that are too lengthy works really well. Assuming the layout of the network is adequate, hiding long links will make the graph look less like a hairball but still show links within smaller communities.
g <- make_data(2000)

graph(g) %>%
  graph_offline_layout(steps = 100) %>%
  scale_link_color_coords() %>%
  hide_long_links(75)
To determine the appropriate length of links to keep you can use the function compute_links_length which returns a data.frame of links and their lengths given the computed layout.
g <- graph(g) %>%
  graph_offline_layout(steps = 100) %>%
  scale_link_color_coords()

lengths <- compute_links_length(g)

The make_data function generates hub and spoke graphs with distinct power law distributions.
The last trick in the book is explained in the JSON part of the guide.