Economic Complexity
Mauricio Vargas' economiccomplexity package to build:
networks commonly used in Economic Complexity to explore bipartite relations such as countries and their exported products. These methods are also useful for different kind of relations such as countries and their spoken languages.

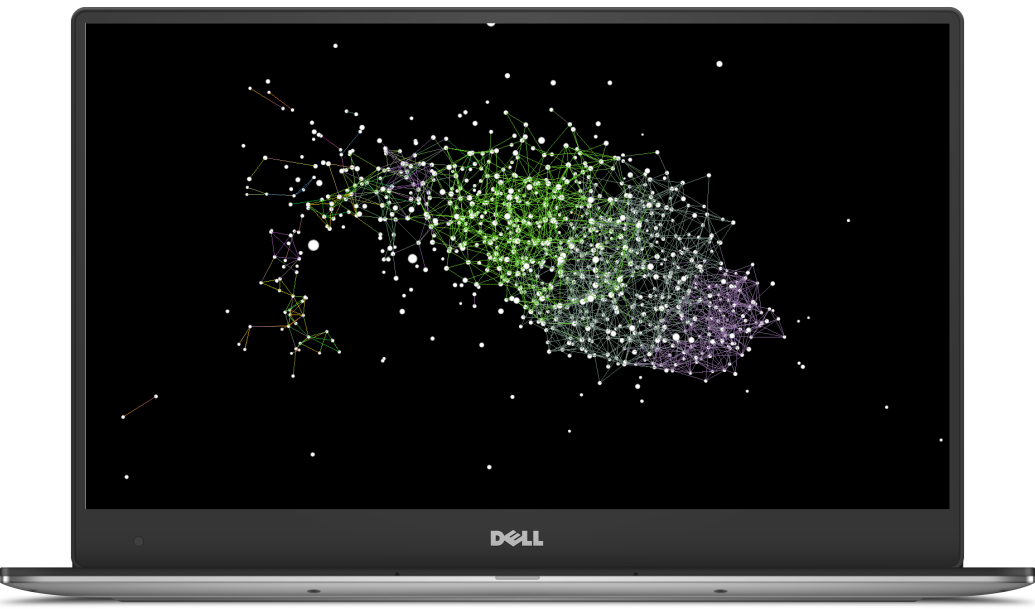
In this post I use the built-in world_trade_avg_1998_to_2000 dataset to produce a proximity network, thanks to our heuristics to visualise large networks we can remove the cutoff points.
# remotes::install_github("pachamaltese/economiccomplexity")
library(economiccomplexity)

bi <- balassa_index(world_trade_avg_1998_to_2000)

pro <- proximity(bi)

net <- projections(pro$proximity_country, pro$proximity_product)
The net$network_p object is essentially an edgelist which we can thus simply pass to our initialisation function. Then of course we hide long edges to avoid drawing a hairball. I also use graph_cluster rather than color the links by coordinates which would not truly reveal clusters given the structure of the graph.
library(grapher)

graph(net$network_product) %>%
  graph_offline_layout(75) %>%
  graph_cluster() %>%
  scale_link_color(cluster, palette = graph_palette_light()) %>%
  hide_long_links(100)